
Dataset
The PCAWG series consists of 2,778 tumour samples (2,703 white listed, 75 grey listed) from 2,658 donors. All samples in this dataset underwent whole-genome sequencing (minimum average coverage 30× in the tumour, 25× in the matched normal samples), and were processed with a set of project-specific pipelines for alignment, variant calling, and quality control4. Copy number calls were established by combining the output of six individual callers into a consensus using a multi-tier approach, resulting in a copy number profile, a purity and ploidy value and whether the tumour has undergone a WGD (Supplementary Information). Consensus subclonal architectures have been obtained by integrating the output of 11 subclonal reconstruction callers, after which all SNVs, indels and structural variants are assigned to a mutation cluster using the MutationTimer.R approach (Supplementary Information). Driver calls have been defined by the PCAWG Driver Working Group4, and mutational signatures are defined by the PCAWG Signatures Working Group24. A more detailed description can be found in Supplementary Information, section 1.
Data accrual was based on sequencing experiments performed by individual member groups of the ICGC and TCGA, as described in an associated study4. As this is a meta-analysis of existing data, power calculations were not performed and the investigators were not blinded to cancer diagnoses.
Timing of gains
We used three related approaches to calculate the timing of copy number gains (see Supplementary Information, section 2). In brief, the common feature is that the expected VAF of a mutation (E) is related to the underlying number of alleles carrying a mutation according to the formula: E[X] = nmfρ/[N (1 − ρ) + Cρ], in which X is the number of reads, n denotes the coverage of the locus, the mutation copy number m is the number of alleles carrying the mutation (which is usually inferred), f is the frequency of the clone carrying the given mutation (f = 1 for clonal mutations). N is the normal copy number (2 on autosomes, 1 or 2 for chromosome X and 0 or 1 for chromosome Y), C is the total copy number of the tumour, and ρ is the purity of the sample.
The number of mutations nm at each allelic copy number m then informs about the time when the gain has occurred. The basic formulae for timing each gain are, depending on the copy number configuration:
$${rm{Copy}},{rm{number}},2+1:T=3{n}_{2}/(2{n}_{2}+{n}_{1})$$
$${rm{Copy}},{rm{number}},2+2:T=2{n}_{2}/(2{n}_{2}+{n}_{1})$$
$${rm{Copy}},{rm{number}},2+0:T=2{n}_{2}/(2{n}_{2}+{n}_{1})$$
in which 2 + 1 refers to major and minor copy number of 2 and 1, respectively. Methods differ slightly in how the number of mutations present on each allele are calculated and how uncertainty is handled (Supplementary Information).
Timing of mutations
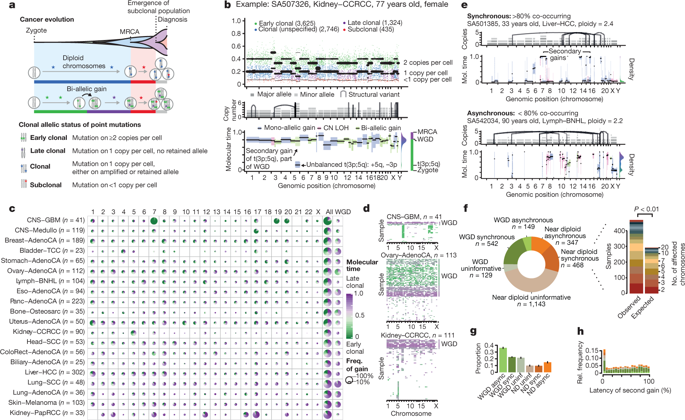
The mutation copy number m and the clonal frequency f is calculated according to the principles indicated above. Details can be found in Supplementary Information, section 2. Mutations with f = 1 are denoted as ‘clonal’, and mutations with f < 1 as ‘subclonal’. Mutations with f = 1 and m > 1 are denoted as ‘early clonal’ (co-amplified). In cases with f = 1, m = 1 and C > 2, mutations were annotated as ‘late clonal’, if the minor copy number was 0, otherwise ‘clonal’ (unspecified).
Timing of driver mutations
A catalogue of driver point mutations (SNVs and indels) was provided by the PCAWG Drivers and Functional Interpretation Group4. The timing category was calculated as above. From the four timing categories, the odds ratios of early/late clonal and clonal (early, late or unspecified clonal)/subclonal were calculated for driver mutations against the distribution of all other mutations present in fragments with the same copy number composition in the samples with each particular driver. The background distribution of these odds ratios was assessed with 1,000 bootstraps (Supplementary Information, section 4.1).
Integrative timing
For each pair of driver point mutations and recurrent copy number alterations, an ordering was established (earlier, later or unspecified). The information underlying this decision was derived from the timing of each driver point mutation, as well as from the timing status of clonal and subclonal copy number segments. These tables were aggregated across all samples and a sports statistics model was employed to calculate the overall ranking of driver mutations. A full description is given in Supplementary Information, section 4.2.
Timing of mutational signatures
Mutational trinucleotide substitution signatures, as defined by the PCAWG Mutational Signatures Working Group24, were fit to samples with observed signature activity, after splitting point mutations into either of the four epochs. A likelihood ratio test based on the multinomial distribution was used to test for differences in the mutation spectra between time points. Time-resolved exposures were calculated using non-negative linear least squares. Full details are given in Supplementary Information, section 5.
Real-time estimation of WGD and MRCA
CpG>TpG mutations were counted in an NpCpG context, except for skin–melanoma, in which CpCpG and TpCpG were excluded owing to the overlapping UV mutation spectrum. For visual comparison, the number of mutations was scaled to the effective genome size, defined as the 1/mean(mi/Ci), in which mi is the estimated number of allelic copies of each mutation, and Ci is the total copy number at that locus, thereby scaling to the final copy number and the time of change.
A hierarchical Bayesian linear regression was fit to relate the age at diagnosis to the scaled number of mutations, ensuring positive slope and intercept through a shared gamma distribution across cancer types.
For tumours with several time points, the set of mutations shared between diagnosis and relapse (nD) and those specific to the relapse (nR) was calculated. The rate acceleration was calculated as: a = nR/nD × tD/tR. This analysis was performed separately for all substitutions and for CpG>TpG mutations.
On the basis of these analyses, a typical increase of 5× for most cancer types was chosen, with a lower value of 2.5× for brain cancers and a value of 7.5× for ovarian cancer.
The correction for transforming an estimate of a copy number gain in mutation time into chronological time depends not only on the rate acceleration, but also on the time at which this acceleration occurred. As this is generally unknown, we performed Monte Carlo simulations of rate accelerations spanning an interval of 15 years before diagnosis, corresponding roughly to 25% of time for a diagnosis at 60 years of age, noting that a 5× rate increase over this duration yields an offset of about 33% of mutations, compatible with our data. Subclonal mutations were assumed to occur at full acceleration. The proportion of subclonal mutations was divided by the number of identified subclones, thus conservatively assuming branching evolution. Full details are given in Supplementary Information, section 6.
Cancer timelines
The results from each of the different timing analyses are combined in timelines of cancer evolution for each tumour type (Fig. 6 and Supplementary Information). Each timeline begins at the fertilized egg, and spans up to the median age of diagnosis within each cohort. Real-time estimates for WGD and the MRCA act as anchor points, allowing us to roughly map the four broadly defined time periods (early clonal, intermediate, late clonal and subclonal) to chronological time during a patient’s lifespan. Specific driver mutations or copy number alterations can be placed within each of these time frames based on their ordering from the league model analysis. Signatures are shown if they typically change over time (95% confidence intervals of mean change not overlapping 0), and if they are strongly active (contributing at least 10% mutations to one time point). Signatures are shown on the timeline in the epoch of their greatest activity. Where an event found in our study has a known timing in the literature, the agreement is annotated on the timeline; with an asterisk denoting an agreed timing, and dagger symbol denoting a timing that is different to our results. Full details are given in Supplementary Information, section 7.
Reporting summary
Further information on research design is available in the Nature Research Reporting Summary linked to this paper.